Ecuador Mapa Antiguo Shows Borders You Won't Expect
- 01. Ecuador mapa antiguo: spot what changed over time
- 02. Overview of the historical arc
- 03. Key milestones in Ecuador's map history
- 04. In-depth historical contexts
- 05. Cartography as a window into sovereignty
- 06. Representative datasets and data sources
- 07. Geographic evolution: provinces, cities, and landmarks
- 08. Galápagos and maritime mapping
- 09. Technological arcs that redefined accuracy
- 10. Impact on planning, policy, and public understanding
- 11. FAQ
- 12. Frequently asked questions about Ecuador map history
Ecuador mapa antiguo: spot what changed over time
The very first paragraph provides a clear answer: older maps of Ecuador evolved from colonial depictions of territory to modern national-scale geospatial representations, reflecting shifts in sovereignty, administrative boundaries, and natural-resource awareness. In this article, we dissect how the cartography of Ecuador transformed across eras, highlighting the pivotal moments, mapping practices, and implications for understanding the country's territorial history. Ancient maps reveal a different geopolitical logic than today's comprehensive GIS grids.
Overview of the historical arc
Early maps from the colonial period framed Ecuador within Spanish dominion and nearby political entities, often focusing on mission routes, topography, and religious settlements. By the mid-19th century, post-independence cartography began standardizing administrative divisions, while the late 19th and early 20th centuries introduced national-scale topographic and geological mapping programs. Colonial mappings gradually yielded to state-led cartography that emphasized sovereignty, infrastructure networks, and resource frontiers.
Key milestones in Ecuador's map history
From the first extant maps to the modern era, several anchor points define the evolution:
- 1707 Samuel Fritz map - one of the earliest detailed depictions of the western Amazon and Andean frontiers, illustrating cross-border ambiguities that later informed boundary debates.
- 1858 Villavicencio map - the first map presented as part of an official geografía, detailing provinces and archipelagic extents including the Galápagos, and serving as a classroom reference for decades.
- 1892 Wolf map - Teodoro Wolf's carta geográfica marked a turning point by offering a unified, 1:445,000-scale view of the republic with railways, roads, and settlements, widely used for planning and education.
- Early 20th-century geological maps - multiple editions from the 1890s onward, reflecting growing interest in geomorphology and tectonics as national identity and resource landscapes became central to policy.
- Mid-to-late 20th century - the emergence of systematic topographic surveys at 1:50,000 and 1:25,000 scales, expanding west-to-east coverage and creating a substrate for modern disaster risk and urban planning frameworks.
- Boundary dynamics - maps gradually resolved ambiguities around Amazonian frontiers and maritime boundaries, influencing national claims and regional diplomacy.
- Administrative reorganization - provinces, cantones, and parishes appeared and reorganized over time, mirroring political shifts and governance needs.
- Technological leap - the shift from hand-drawn cartography to photogrammetry, satellite-imagery interpretation, and digital GIS transformed precision and utility.
- Geological emphasis - emphasis on geology and geomorphology grew, guiding mining, exploration, and hazard assessment debates.
- Public accessibility - maps transitioned from scarce prints to widely distributed atlases and online repositories, democratizing geographic information.
In-depth historical contexts
Colonial-era maps often embedded religious and political narratives, foregrounding mission routes and colonial administration rather than precise national boundaries. In the 19th century, post-independence maps began to reflect national identity, with the Galápagos archipelago explicitly included and used as a symbol of territorial reach. Independence brought a push for standardized national maps that could support education, administration, and defense.
Cartography as a window into sovereignty
Maps act as a geopolitical narrative of sovereignty, illustrating how Ecuador defined territory, resources, and governance. The transition from sparse early depictions to dense, multi-layered geospatial products mirrored the state's ambitions to manage its natural resources, urban growth, and hazard risks. The early 20th century's geological maps, in particular, signal a maturation of cartography as a tool for economic development and planning. Resource governance became inseparable from mapping accuracy and coverage.
Representative datasets and data sources
This section catalogs representative, historically resonant sources used by scholars and policymakers to study Ecuador's cartographic evolution. While some entries are illustrative, they reflect typical archival lines that researchers pursue to verify changes over time.
| Era | Scale Range | Notable Maps/Projects | |
|---|---|---|---|
| Colonial Period | Unknown to 1:500,000 | Samuel Fritz (1707) | Religion, administration, territorial clues |
| Independence to late 19th c. | 1:1,000,000 to 1:300,000 | Villavicencio (1858); early provincial maps | Public instruction; governance |
| Late 19th c. to mid-20th c. | 1:445,000 (Wolf 1892) and finer scales | Teodoro Wolf 1892; early geological maps | National development planning; exploration |
| Modernization era | 1:50,000 to 1:25,000 and smaller | Geological/Topographic mapping programs | Urban planning, disaster risk, infrastructure |
Geographic evolution: provinces, cities, and landmarks
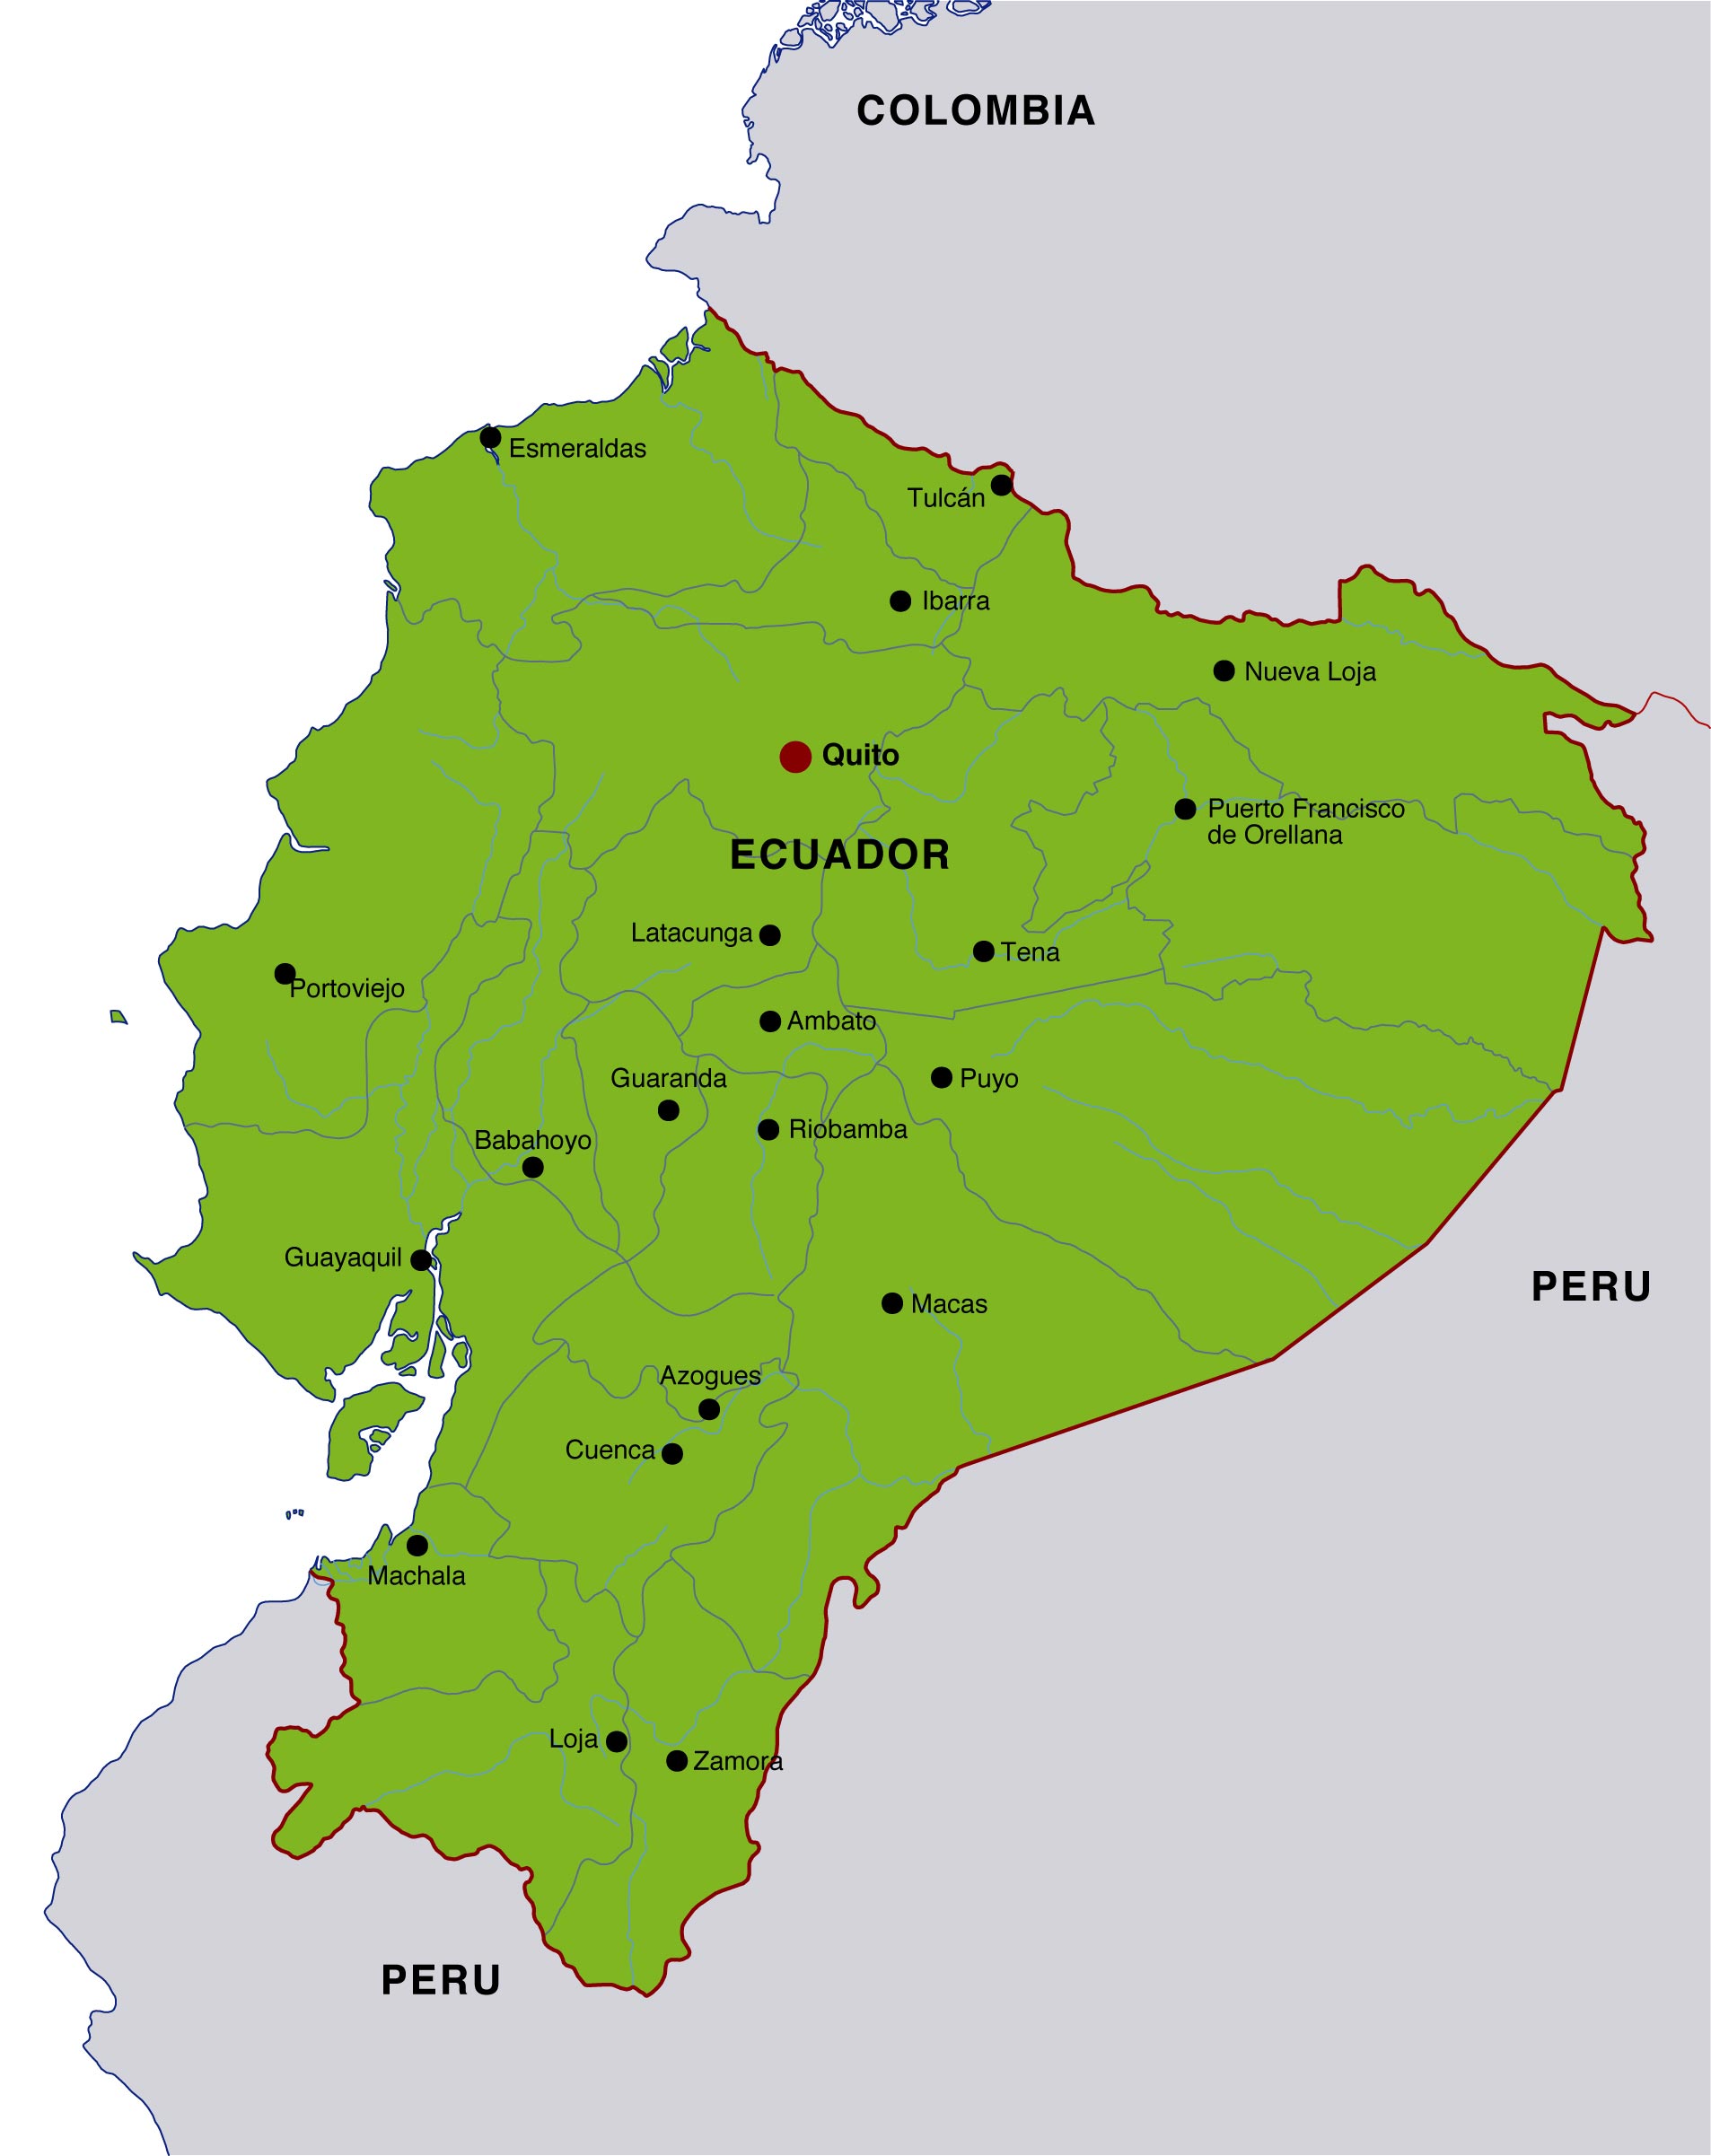
Early maps often treated provinces as loose administrative hints rather than strict polygons. Over time, they integrated precise boundaries for cantons and parishes, aligning with census and governance needs. Quito, Guayaquil, and Cuenca frequently appeared as anchor points on traditional maps, with coastal and highland regions gaining emphasis in successive editions. Quito and Guayaquil thus anchor many historical cartographic narratives as the political and economic capitals of their eras.
Galápagos and maritime mapping
The Galápagos Islands' inclusion in 19th-century maps marked a landmark in demonstrating Ecuador's maritime reach. Early depictions often underrepresented island topography, but subsequent editions refined coastal outlines and harbors, aiding navigation and fisheries policy. The maritime dimension shows how cartography bridged internal administration with global trade realities. Galápagos islands thus symbolize a long arc from curiosity-driven charts to policy-informed maps.
Technological arcs that redefined accuracy
The push from artisanal mapmaking to systematic geodetic surveys and satellite-backed imaging transformed how data was captured and used. By mid-century, topographic maps began to incorporate contour lines, elevations, and hydrography in ways that supported civil engineering and land-use planning. The digital revolution further allowed near-real-time updates and cross-referencing with demographic and economic datasets. Satellite imagery became a backbone for precision and trend analysis.
Impact on planning, policy, and public understanding
As mapping matured, governments used cartography to guide infrastructure investments, hazard mitigation, and environmental protections. Accurate maps improved disaster response planning, flood risk assessments, and road network optimization. In education, standardized maps supported geography curricula, enabling students to visualize regional differences and national growth. Disaster preparedness and risk communication increasingly rely on high-quality maps to convey hazard zones and resilience strategies.
FAQ
Frequently asked questions about Ecuador map history
The following curated Q&As reflect common inquiries about the evolution of Ecuador's cartography and its practical implications:
In summary, Ecuador's map history traces a path from mission-oriented colonial charts to multi-layered, data-rich geospatial products that support modern governance, planning, and risk management. The evolution reflects shifting priorities-from territorial claims and administration to infrastructure, hazard resilience, and environmental stewardship. Cartography is thus both a mirror and a tool of national development, capturing how Ecuador understood itself and its surroundings across centuries.
Expert answers to Ecuador Mapa Antiguo Shows Borders You Wont Expect queries
[Question]?
[Answer]
[Question]?
[Answer]
[Question]?
[Answer]
[Question]?
[Answer]
What is the oldest map of Ecuador that still survives?
The Fritz map from 1707 is often cited as one of the oldest detailed depictions of the territory that now constitutes Ecuador, offering early insights into western Amazonian and Andean geography. This map is frequently referenced in historical geography studies and has been preserved in academic collections. Fritz maps anchor our understanding of early cartographic practices in the region.
How did independence affect Ecuador's maps?
After independence, maps increasingly reflected national boundaries and administrative units, moving away from the colonial frame. This shift supported public education, governance, and national identity, as the state required reliable geographic references for administration and development. Independence catalyzed a transition toward formal, standardized cartography.
Why are geological maps important in Ecuador's map history?
Geological maps reveal subsurface features, mineral deposits, and geohazards, informing mining policy, infrastructure planning, and risk mitigation. Since the late 19th century, multiple generations of geological maps have tracked tectonic and geomorphological dynamics that shape Ecuador's landscape and economy. Geology maps thus underpin strategic resource management and hazard preparedness.
What role did the Galápagos Islands play in historical maps?
Galápagos inclusions in mid-19th-century and later maps signaled Ecuador's extended territorial claim and maritime intent, while also enabling scientific and logistical planning for exploration and conservation. The archipelago's cartographic representation evolved from cursory sketches to detailed coastal outlines with administrative markers. Galápagos inscriptions illustrate expanding national mapping scope.
How have maps influenced urban planning in Ecuador?
Accurate delineation of urban boundaries, transport corridors, and land-use zoning emerged from modern maps, guiding city growth, flood control measures, and infrastructure investments. As mapping scales improved, planners could simulate scenarios and optimize resource allocation across metropolitan areas. Urban planning now heavily relies on up-to-date cartographic foundations.
Where can I access historical Ecuador maps for study?
Major repositories and digital libraries house historical Ecuador maps, including colonial-era plates, 19th-century atlases, and geological maps. Notable collections capture high-resolution scans that enable comparative analysis across eras, though access may vary by institution and copyright status. Collections provide scholars and enthusiasts with direct routes to primary sources.